
README.md (9564B)
1 # Fork Information 2 3 This is a fork of Brendan's original flamegraph repo. The only functional change 4 in this fork is the removal of J***S***** inserted into the svgs for 5 interactivity. I'd rather have non-interactive SVGs than to further the 6 proliferation of J***S*****. 7 8 # Flame Graphs visualize profiled code 9 10 Main Website: http://www.brendangregg.com/flamegraphs.html 11 12 Example (click to zoom): 13 14 [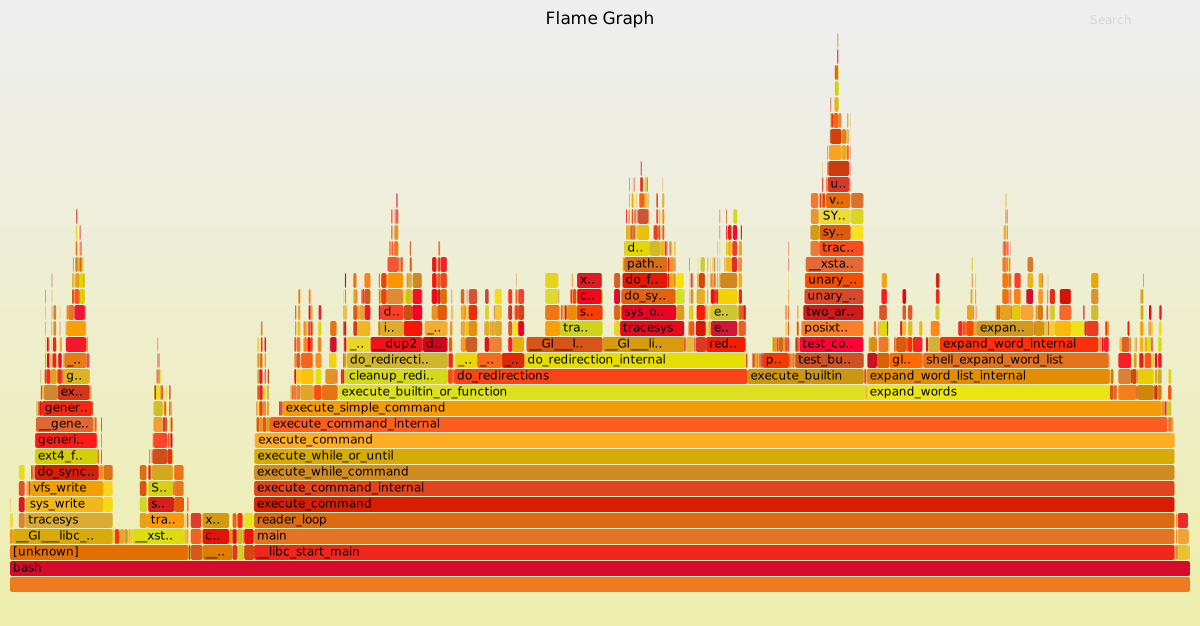](http://www.brendangregg.com/FlameGraphs/cpu-bash-flamegraph.svg) 15 16 Click a box to zoom the Flame Graph to this stack frame only. 17 To search and highlight all stack frames matching a regular expression, click the _search_ button in the upper right corner or press Ctrl-F. 18 By default, search is case sensitive, but this can be toggled by pressing Ctrl-I or by clicking the _ic_ button in the upper right corner. 19 20 Other sites: 21 - The Flame Graph article in ACMQ and CACM: http://queue.acm.org/detail.cfm?id=2927301 http://cacm.acm.org/magazines/2016/6/202665-the-flame-graph/abstract 22 - CPU profiling using Linux perf\_events, DTrace, SystemTap, or ktap: http://www.brendangregg.com/FlameGraphs/cpuflamegraphs.html 23 - CPU profiling using XCode Instruments: http://schani.wordpress.com/2012/11/16/flame-graphs-for-instruments/ 24 - CPU profiling using Xperf.exe: http://randomascii.wordpress.com/2013/03/26/summarizing-xperf-cpu-usage-with-flame-graphs/ 25 - Memory profiling: http://www.brendangregg.com/FlameGraphs/memoryflamegraphs.html 26 - Other examples, updates, and news: http://www.brendangregg.com/flamegraphs.html#Updates 27 28 Flame graphs can be created in three steps: 29 30 1. Capture stacks 31 2. Fold stacks 32 3. flamegraph.pl 33 34 1\. Capture stacks 35 ================= 36 Stack samples can be captured using Linux perf\_events, FreeBSD pmcstat (hwpmc), DTrace, SystemTap, and many other profilers. See the stackcollapse-\* converters. 37 38 ### Linux perf\_events 39 40 Using Linux perf\_events (aka "perf") to capture 60 seconds of 99 Hertz stack samples, both user- and kernel-level stacks, all processes: 41 42 ``` 43 # perf record -F 99 -a -g -- sleep 60 44 # perf script > out.perf 45 ``` 46 47 Now only capturing PID 181: 48 49 ``` 50 # perf record -F 99 -p 181 -g -- sleep 60 51 # perf script > out.perf 52 ``` 53 54 ### DTrace 55 56 Using DTrace to capture 60 seconds of kernel stacks at 997 Hertz: 57 58 ``` 59 # dtrace -x stackframes=100 -n 'profile-997 /arg0/ { @[stack()] = count(); } tick-60s { exit(0); }' -o out.kern_stacks 60 ``` 61 62 Using DTrace to capture 60 seconds of user-level stacks for PID 12345 at 97 Hertz: 63 64 ``` 65 # dtrace -x ustackframes=100 -n 'profile-97 /pid == 12345 && arg1/ { @[ustack()] = count(); } tick-60s { exit(0); }' -o out.user_stacks 66 ``` 67 68 60 seconds of user-level stacks, including time spent in-kernel, for PID 12345 at 97 Hertz: 69 70 ``` 71 # dtrace -x ustackframes=100 -n 'profile-97 /pid == 12345/ { @[ustack()] = count(); } tick-60s { exit(0); }' -o out.user_stacks 72 ``` 73 74 Switch `ustack()` for `jstack()` if the application has a ustack helper to include translated frames (eg, node.js frames; see: http://dtrace.org/blogs/dap/2012/01/05/where-does-your-node-program-spend-its-time/). The rate for user-level stack collection is deliberately slower than kernel, which is especially important when using `jstack()` as it performs additional work to translate frames. 75 76 2\. Fold stacks 77 ============== 78 Use the stackcollapse programs to fold stack samples into single lines. The programs provided are: 79 80 - `stackcollapse.pl`: for DTrace stacks 81 - `stackcollapse-perf.pl`: for Linux perf_events "perf script" output 82 - `stackcollapse-pmc.pl`: for FreeBSD pmcstat -G stacks 83 - `stackcollapse-stap.pl`: for SystemTap stacks 84 - `stackcollapse-instruments.pl`: for XCode Instruments 85 - `stackcollapse-vtune.pl`: for Intel VTune profiles 86 - `stackcollapse-ljp.awk`: for Lightweight Java Profiler 87 - `stackcollapse-jstack.pl`: for Java jstack(1) output 88 - `stackcollapse-gdb.pl`: for gdb(1) stacks 89 - `stackcollapse-go.pl`: for Golang pprof stacks 90 - `stackcollapse-vsprof.pl`: for Microsoft Visual Studio profiles 91 - `stackcollapse-wcp.pl`: for wallClockProfiler output 92 93 Usage example: 94 95 ``` 96 For perf_events: 97 $ ./stackcollapse-perf.pl out.perf > out.folded 98 99 For DTrace: 100 $ ./stackcollapse.pl out.kern_stacks > out.kern_folded 101 ``` 102 103 The output looks like this: 104 105 ``` 106 unix`_sys_sysenter_post_swapgs 1401 107 unix`_sys_sysenter_post_swapgs;genunix`close 5 108 unix`_sys_sysenter_post_swapgs;genunix`close;genunix`closeandsetf 85 109 unix`_sys_sysenter_post_swapgs;genunix`close;genunix`closeandsetf;c2audit`audit_closef 26 110 unix`_sys_sysenter_post_swapgs;genunix`close;genunix`closeandsetf;c2audit`audit_setf 5 111 unix`_sys_sysenter_post_swapgs;genunix`close;genunix`closeandsetf;genunix`audit_getstate 6 112 unix`_sys_sysenter_post_swapgs;genunix`close;genunix`closeandsetf;genunix`audit_unfalloc 2 113 unix`_sys_sysenter_post_swapgs;genunix`close;genunix`closeandsetf;genunix`closef 48 114 [...] 115 ``` 116 117 3\. flamegraph.pl 118 ================ 119 Use flamegraph.pl to render a SVG. 120 121 ``` 122 $ ./flamegraph.pl out.kern_folded > kernel.svg 123 ``` 124 125 An advantage of having the folded input file (and why this is separate to flamegraph.pl) is that you can use grep for functions of interest. Eg: 126 127 ``` 128 $ grep cpuid out.kern_folded | ./flamegraph.pl > cpuid.svg 129 ``` 130 131 Provided Examples 132 ================= 133 134 ### Linux perf\_events 135 136 An example output from Linux "perf script" is included, gzip'd, as example-perf-stacks.txt.gz. The resulting flame graph is example-perf.svg: 137 138 [](http://www.brendangregg.com/FlameGraphs/example-perf.svg) 139 140 You can create this using: 141 142 ``` 143 $ gunzip -c example-perf-stacks.txt.gz | ./stackcollapse-perf.pl --all | ./flamegraph.pl --color=java --hash > example-perf.svg 144 ``` 145 146 This shows my typical workflow: I'll gzip profiles on the target, then copy them to my laptop for analysis. Since I have hundreds of profiles, I leave them gzip'd! 147 148 Since this profile included Java, I used the flamegraph.pl --color=java palette. I've also used stackcollapse-perf.pl --all, which includes all annotations that help flamegraph.pl use separate colors for kernel and user level code. The resulting flame graph uses: green == Java, yellow == C++, red == user-mode native, orange == kernel. 149 150 This profile was from an analysis of vert.x performance. The benchmark client, wrk, is also visible in the flame graph. 151 152 ### DTrace 153 154 An example output from DTrace is also included, example-dtrace-stacks.txt, and the resulting flame graph, example-dtrace.svg: 155 156 [](http://www.brendangregg.com/FlameGraphs/example-dtrace.svg) 157 158 You can generate this using: 159 160 ``` 161 $ ./stackcollapse.pl example-stacks.txt | ./flamegraph.pl > example.svg 162 ``` 163 164 This was from a particular performance investigation: the Flame Graph identified that CPU time was spent in the lofs module, and quantified that time. 165 166 167 Options 168 ======= 169 See the USAGE message (--help) for options: 170 171 USAGE: ./flamegraph.pl [options] infile > outfile.svg 172 173 --title TEXT # change title text 174 --subtitle TEXT # second level title (optional) 175 --width NUM # width of image (default 1200) 176 --height NUM # height of each frame (default 16) 177 --minwidth NUM # omit smaller functions. In pixels or use "%" for 178 # percentage of time (default 0.1 pixels) 179 --fonttype FONT # font type (default "Verdana") 180 --fontsize NUM # font size (default 12) 181 --countname TEXT # count type label (default "samples") 182 --nametype TEXT # name type label (default "Function:") 183 --colors PALETTE # set color palette. choices are: hot (default), mem, 184 # io, wakeup, chain, java, js, perl, red, green, blue, 185 # aqua, yellow, purple, orange 186 --bgcolors COLOR # set background colors. gradient choices are yellow 187 # (default), blue, green, grey; flat colors use "#rrggbb" 188 --hash # colors are keyed by function name hash 189 --cp # use consistent palette (palette.map) 190 --reverse # generate stack-reversed flame graph 191 --inverted # icicle graph 192 --flamechart # produce a flame chart (sort by time, do not merge stacks) 193 --negate # switch differential hues (blue<->red) 194 --notes TEXT # add notes comment in SVG (for debugging) 195 --help # this message 196 197 eg, 198 ./flamegraph.pl --title="Flame Graph: malloc()" trace.txt > graph.svg 199 200 As suggested in the example, flame graphs can process traces of any event, 201 such as malloc()s, provided stack traces are gathered. 202 203 204 Consistent Palette 205 ================== 206 If you use the `--cp` option, it will use the $colors selection and randomly 207 generate the palette like normal. Any future flamegraphs created using the `--cp` 208 option will use the same palette map. Any new symbols from future flamegraphs 209 will have their colors randomly generated using the $colors selection. 210 211 If you don't like the palette, just delete the palette.map file. 212 213 This allows your to change your colorscheme between flamegraphs to make the 214 differences REALLY stand out. 215 216 Example: 217 218 Say we have 2 captures, one with a problem, and one when it was working 219 (whatever "it" is): 220 221 ``` 222 cat working.folded | ./flamegraph.pl --cp > working.svg 223 # this generates a palette.map, as per the normal random generated look. 224 225 cat broken.folded | ./flamegraph.pl --cp --colors mem > broken.svg 226 # this svg will use the same palette.map for the same events, but a very 227 # different colorscheme for any new events. 228 ``` 229 230 Take a look at the demo directory for an example: 231 232 palette-example-working.svg 233 palette-example-broken.svg